Types of stat
Call wait time in seconds
Total number up to 4 digits
number per 1,000
Percentage
Will each stat need the following?
Within target
Movement on previous
Statistics module with numbers
This version uses the statistics module. The advantages are: it's an animation so add movement. And, it's quick to produce, we don't need images from Deb. The disadvantages are: format is a little restrictive, but still workable. It has to be number followed by descriptor (%, seconds etc). If we want to display whether we're on target or the year on year difference, we'd have to do it in the text. So that is not 'at a glance'.
Customer satisfaction with repairs
We have room for more explanatory text here. We'd have to write wither it was within target and what the year on year movement was.
Average call wait time
Description, within target and year on year movement
Gas compliance
The pecentage of our homes that are compliant for gas certification. Within target and year on year movement
Decent Homes Standard
Number of homes meeting the Decent Homes Standard. Within target and year on year
ASB cases
Number of ASB cases per 1,000 homes
Total contacts
Total number of call, email and Live Chat conversations
Accordion module with images
Advantages: displays a large image
Disadvantages: requires a jpg to be produced.
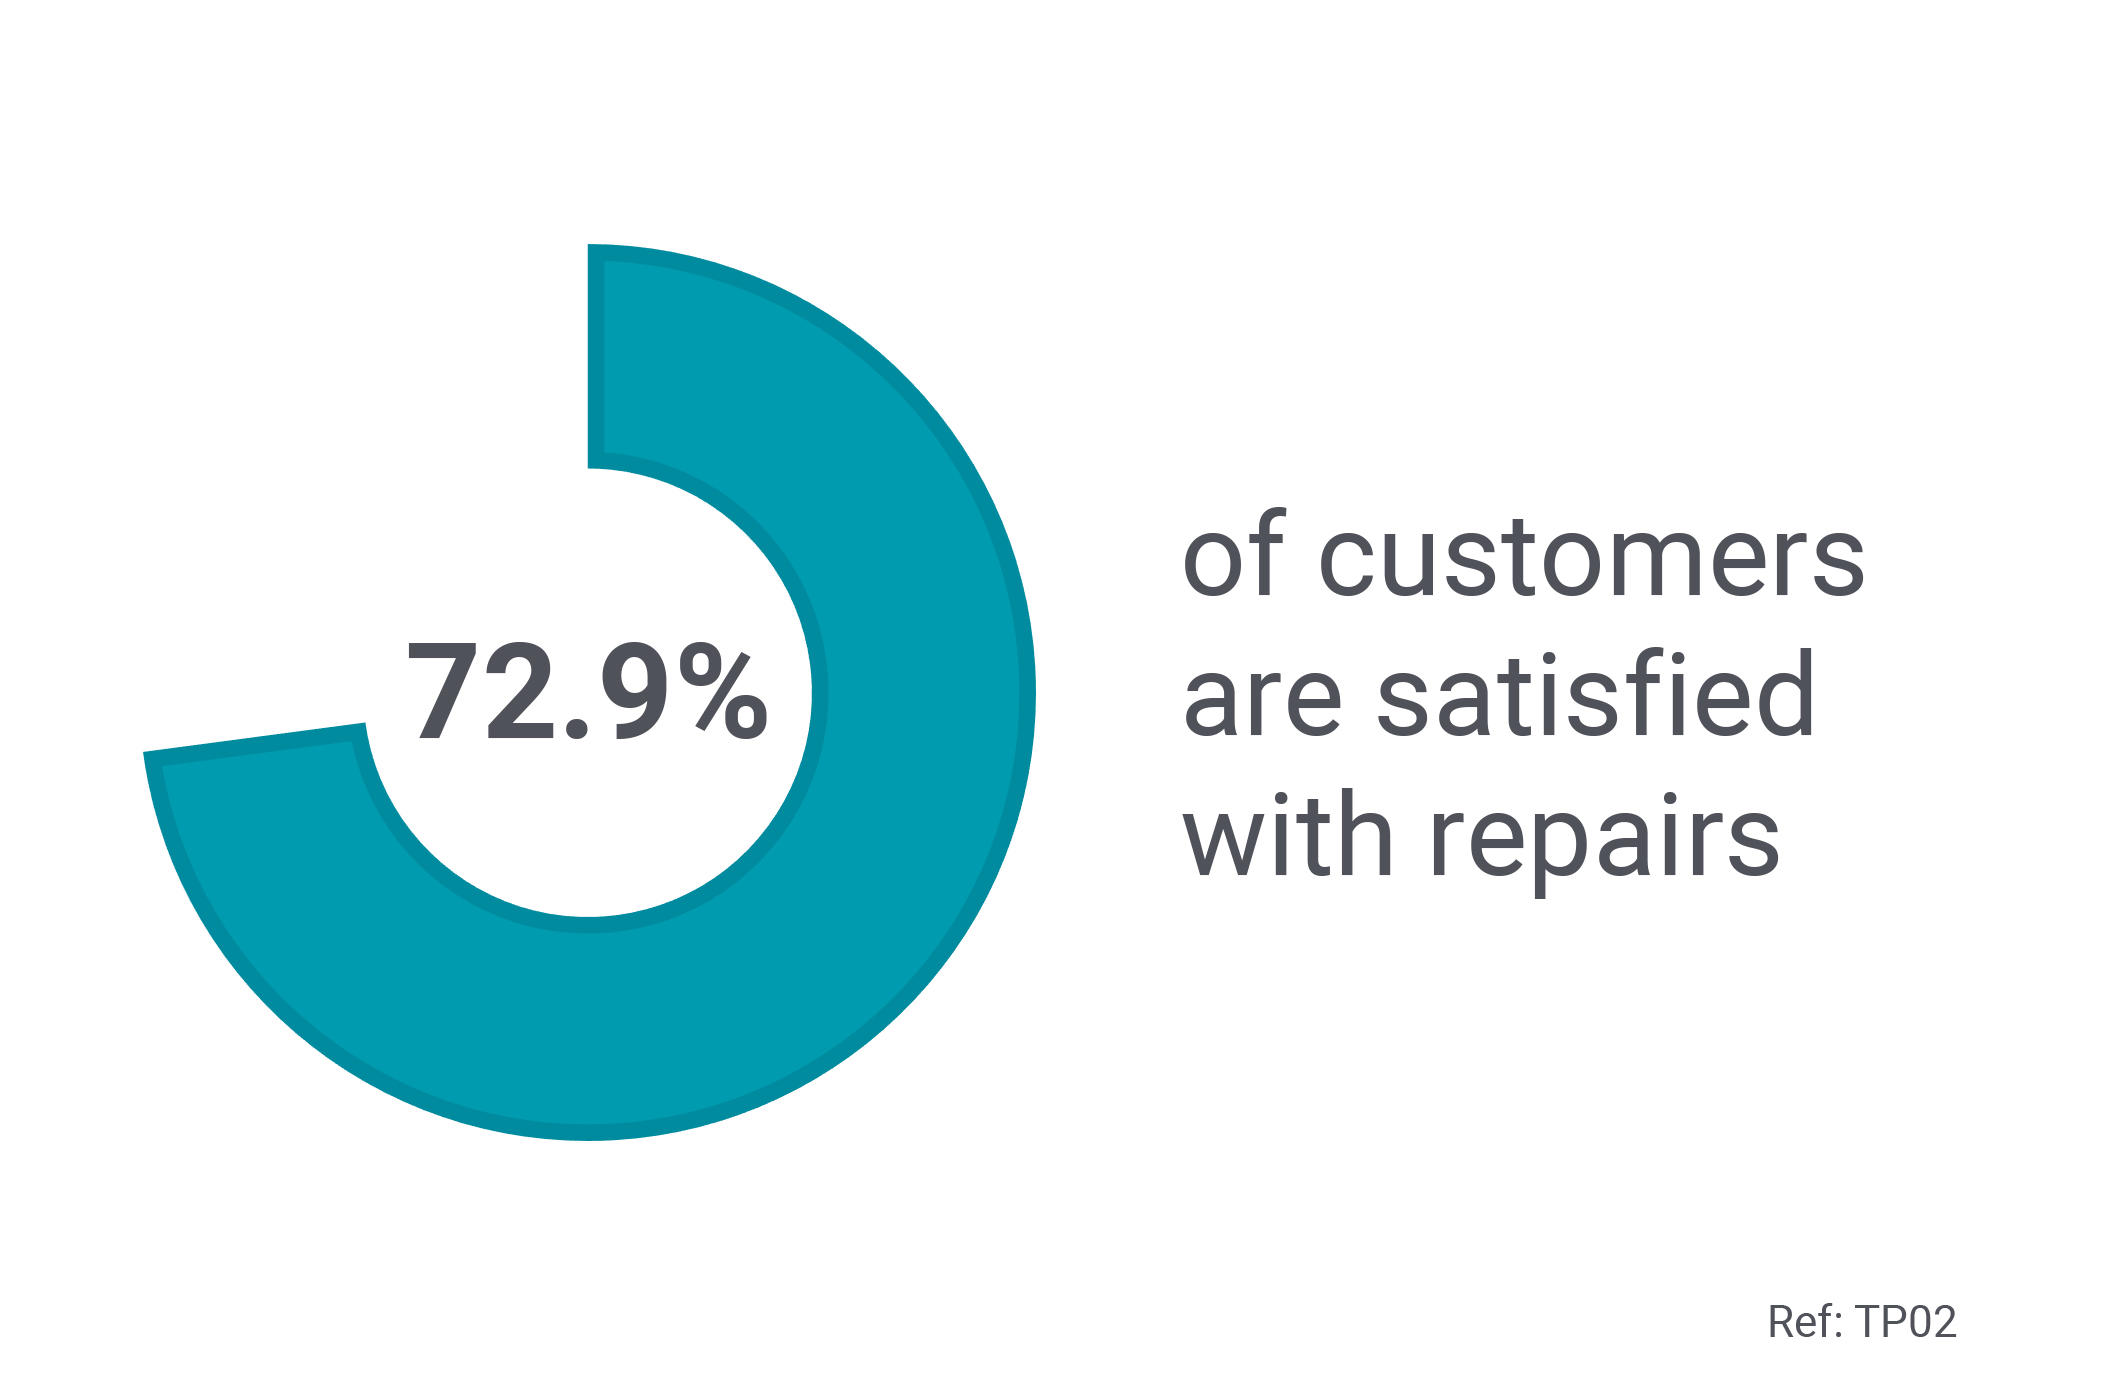
Room for any explanatory text here
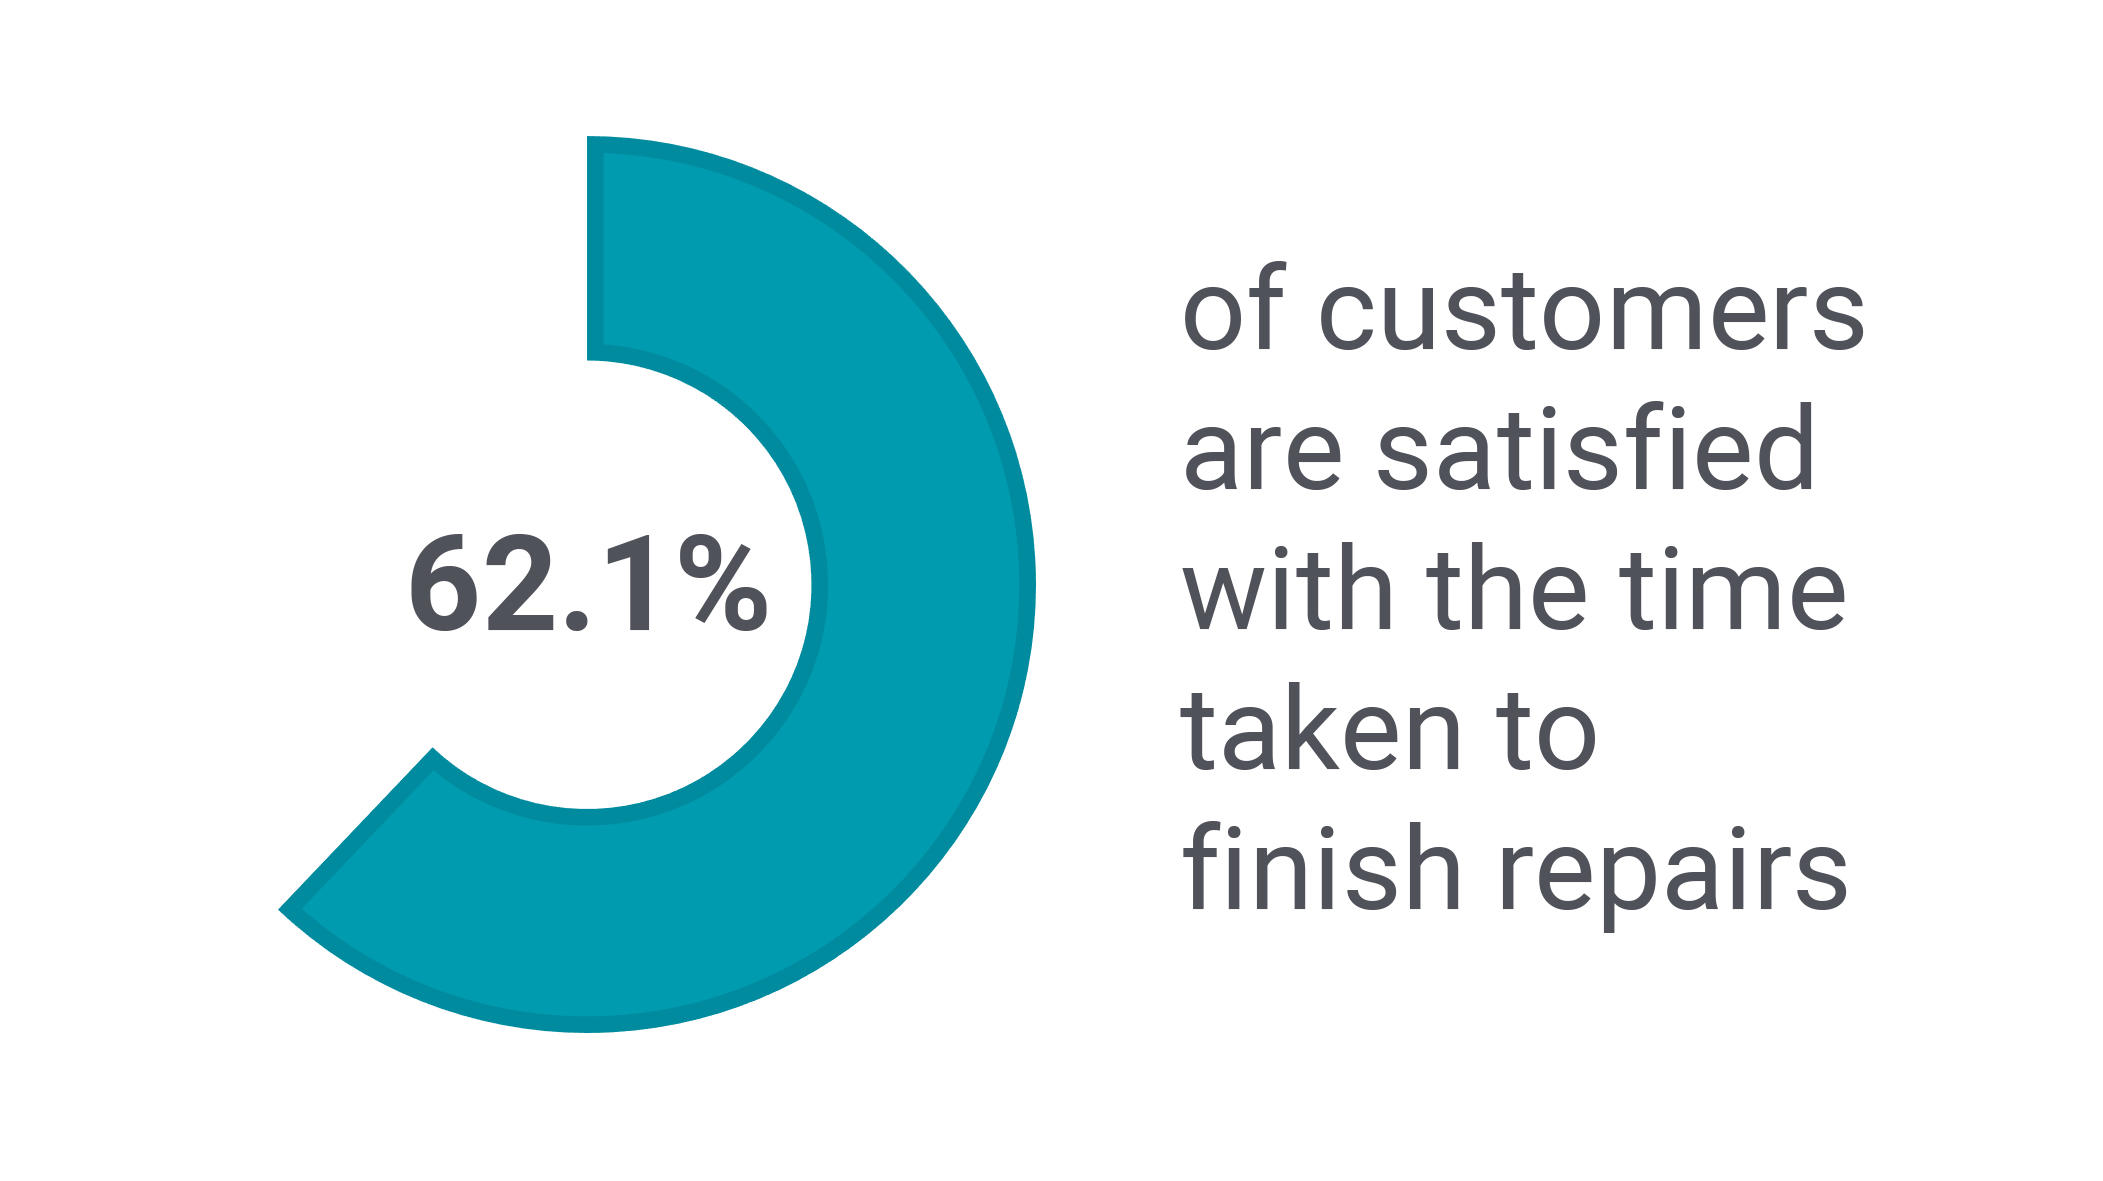
Ref: TP03
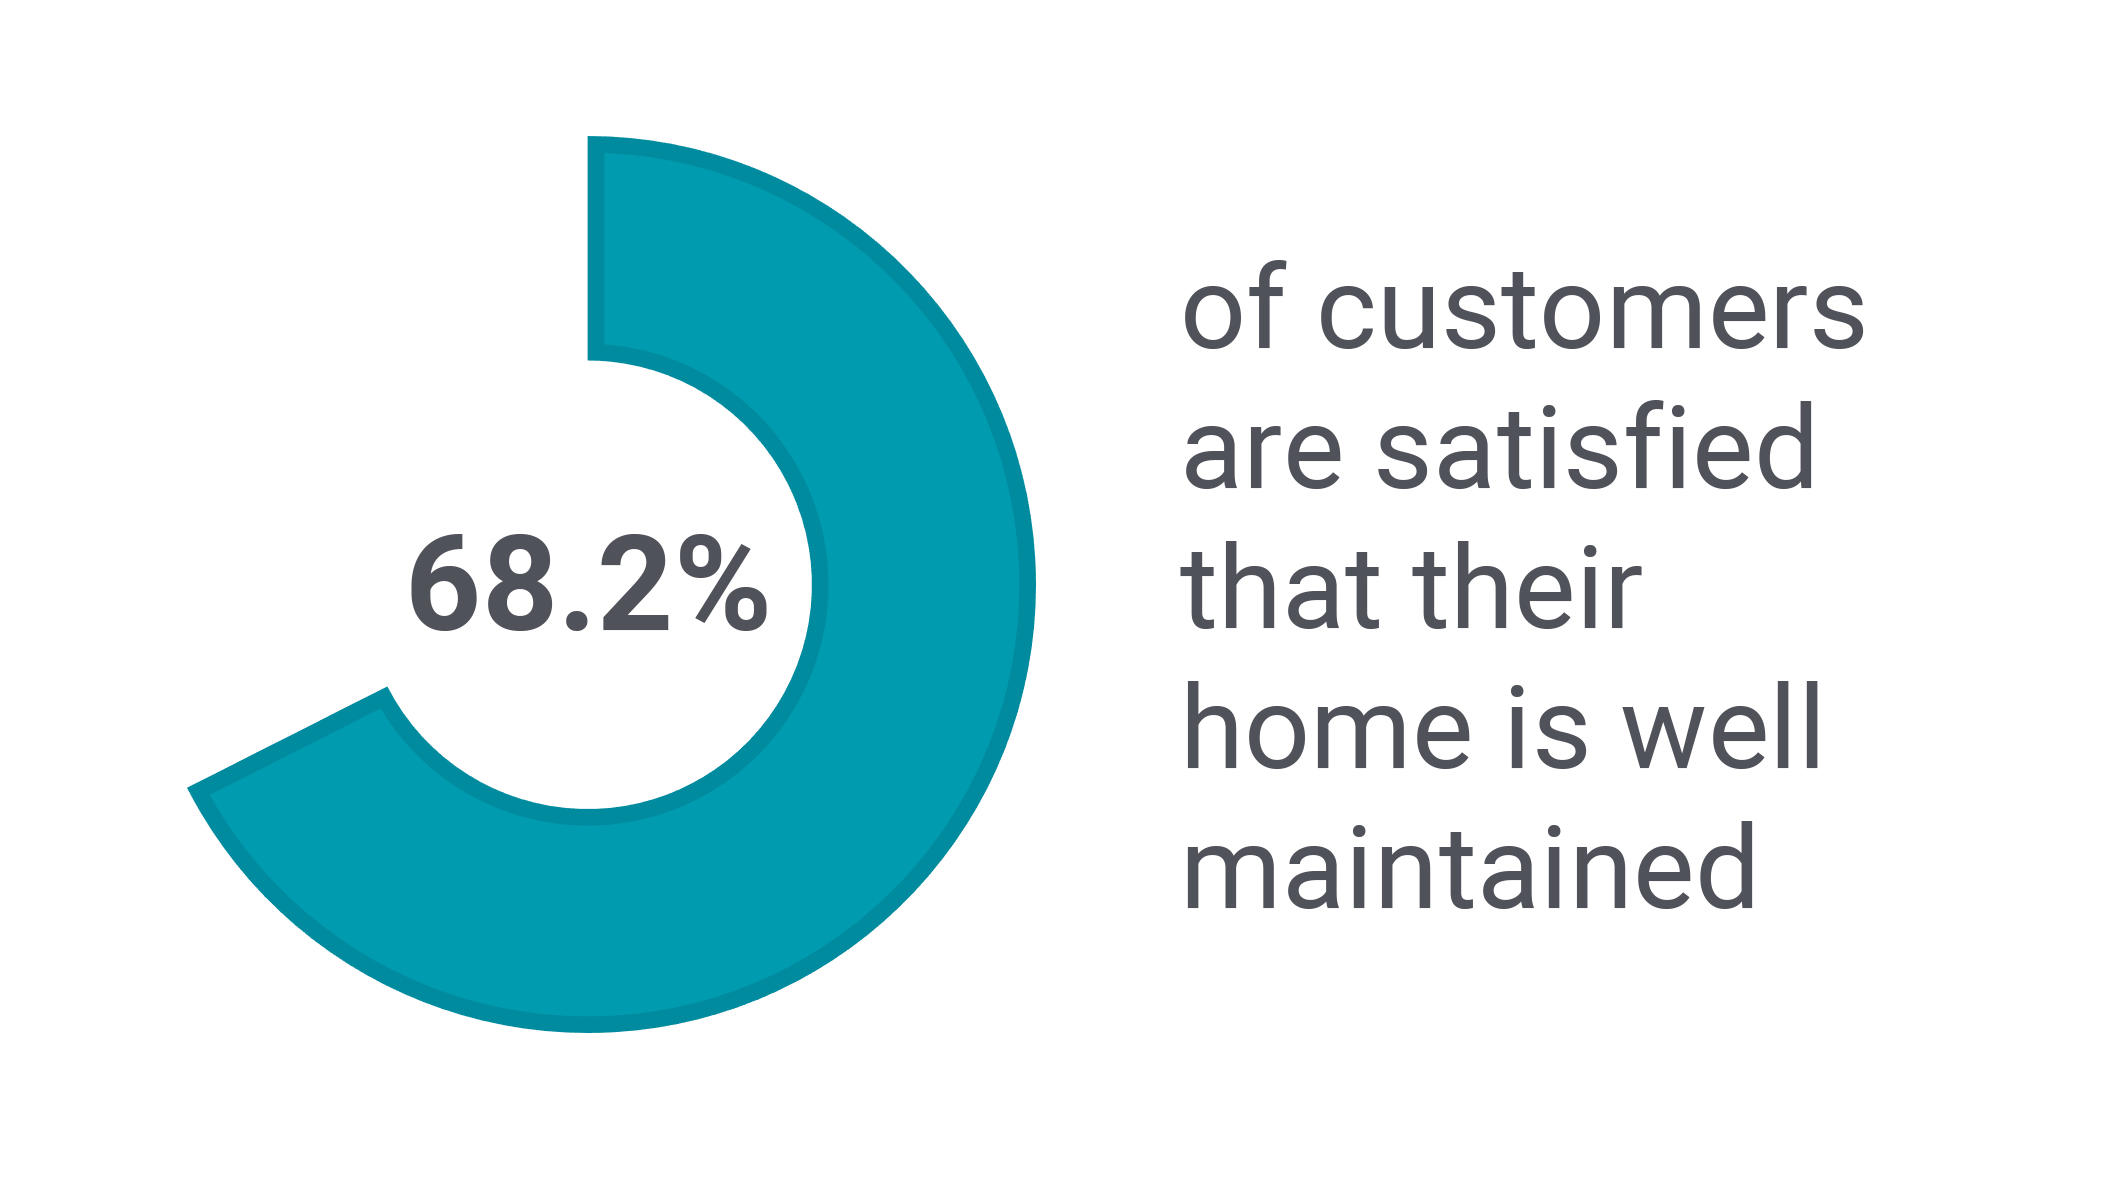
Ref: TP04
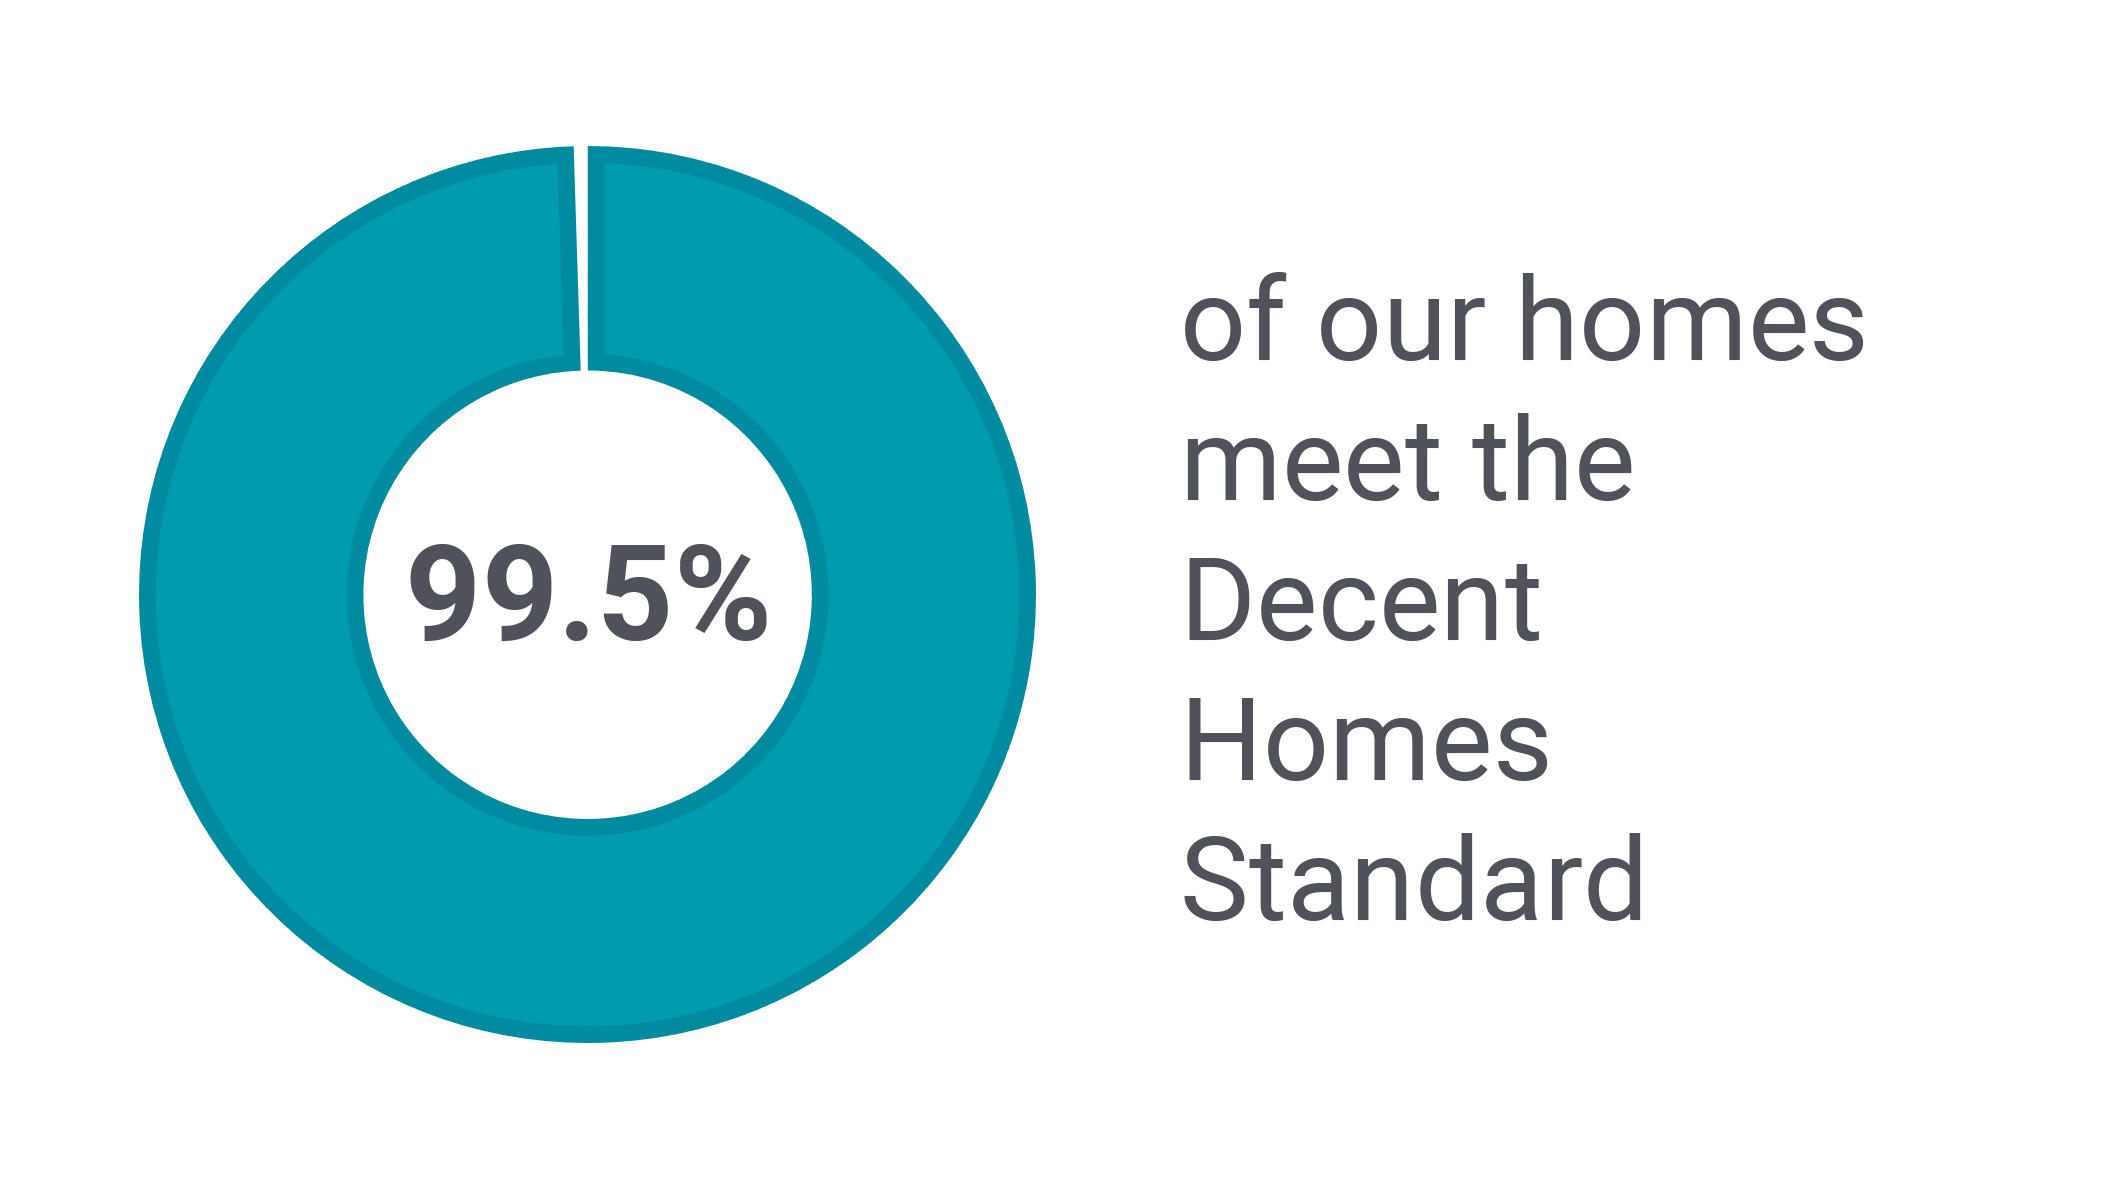
Ref: RP01
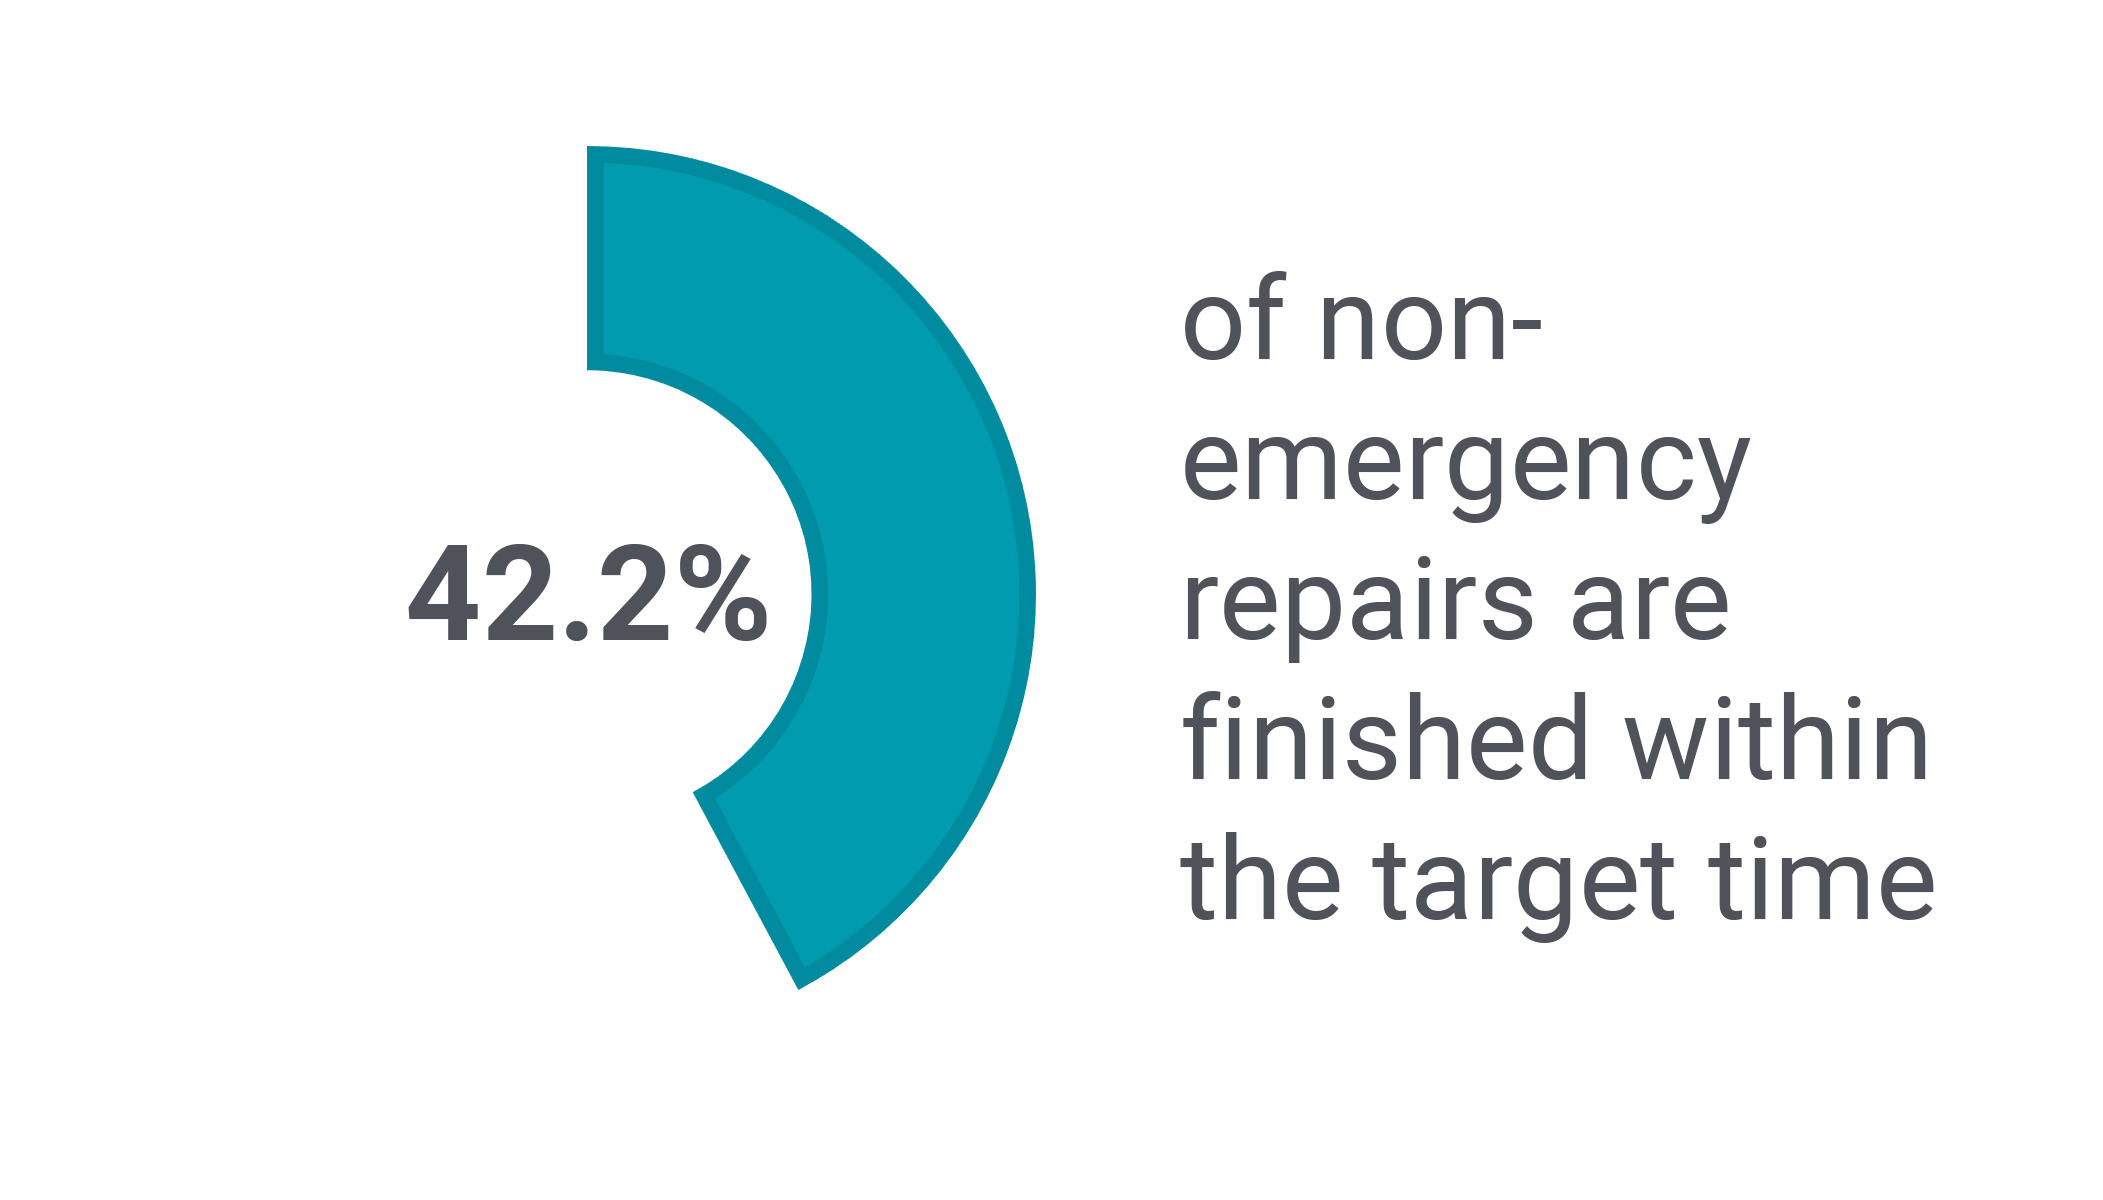
Ref: RP02(1)
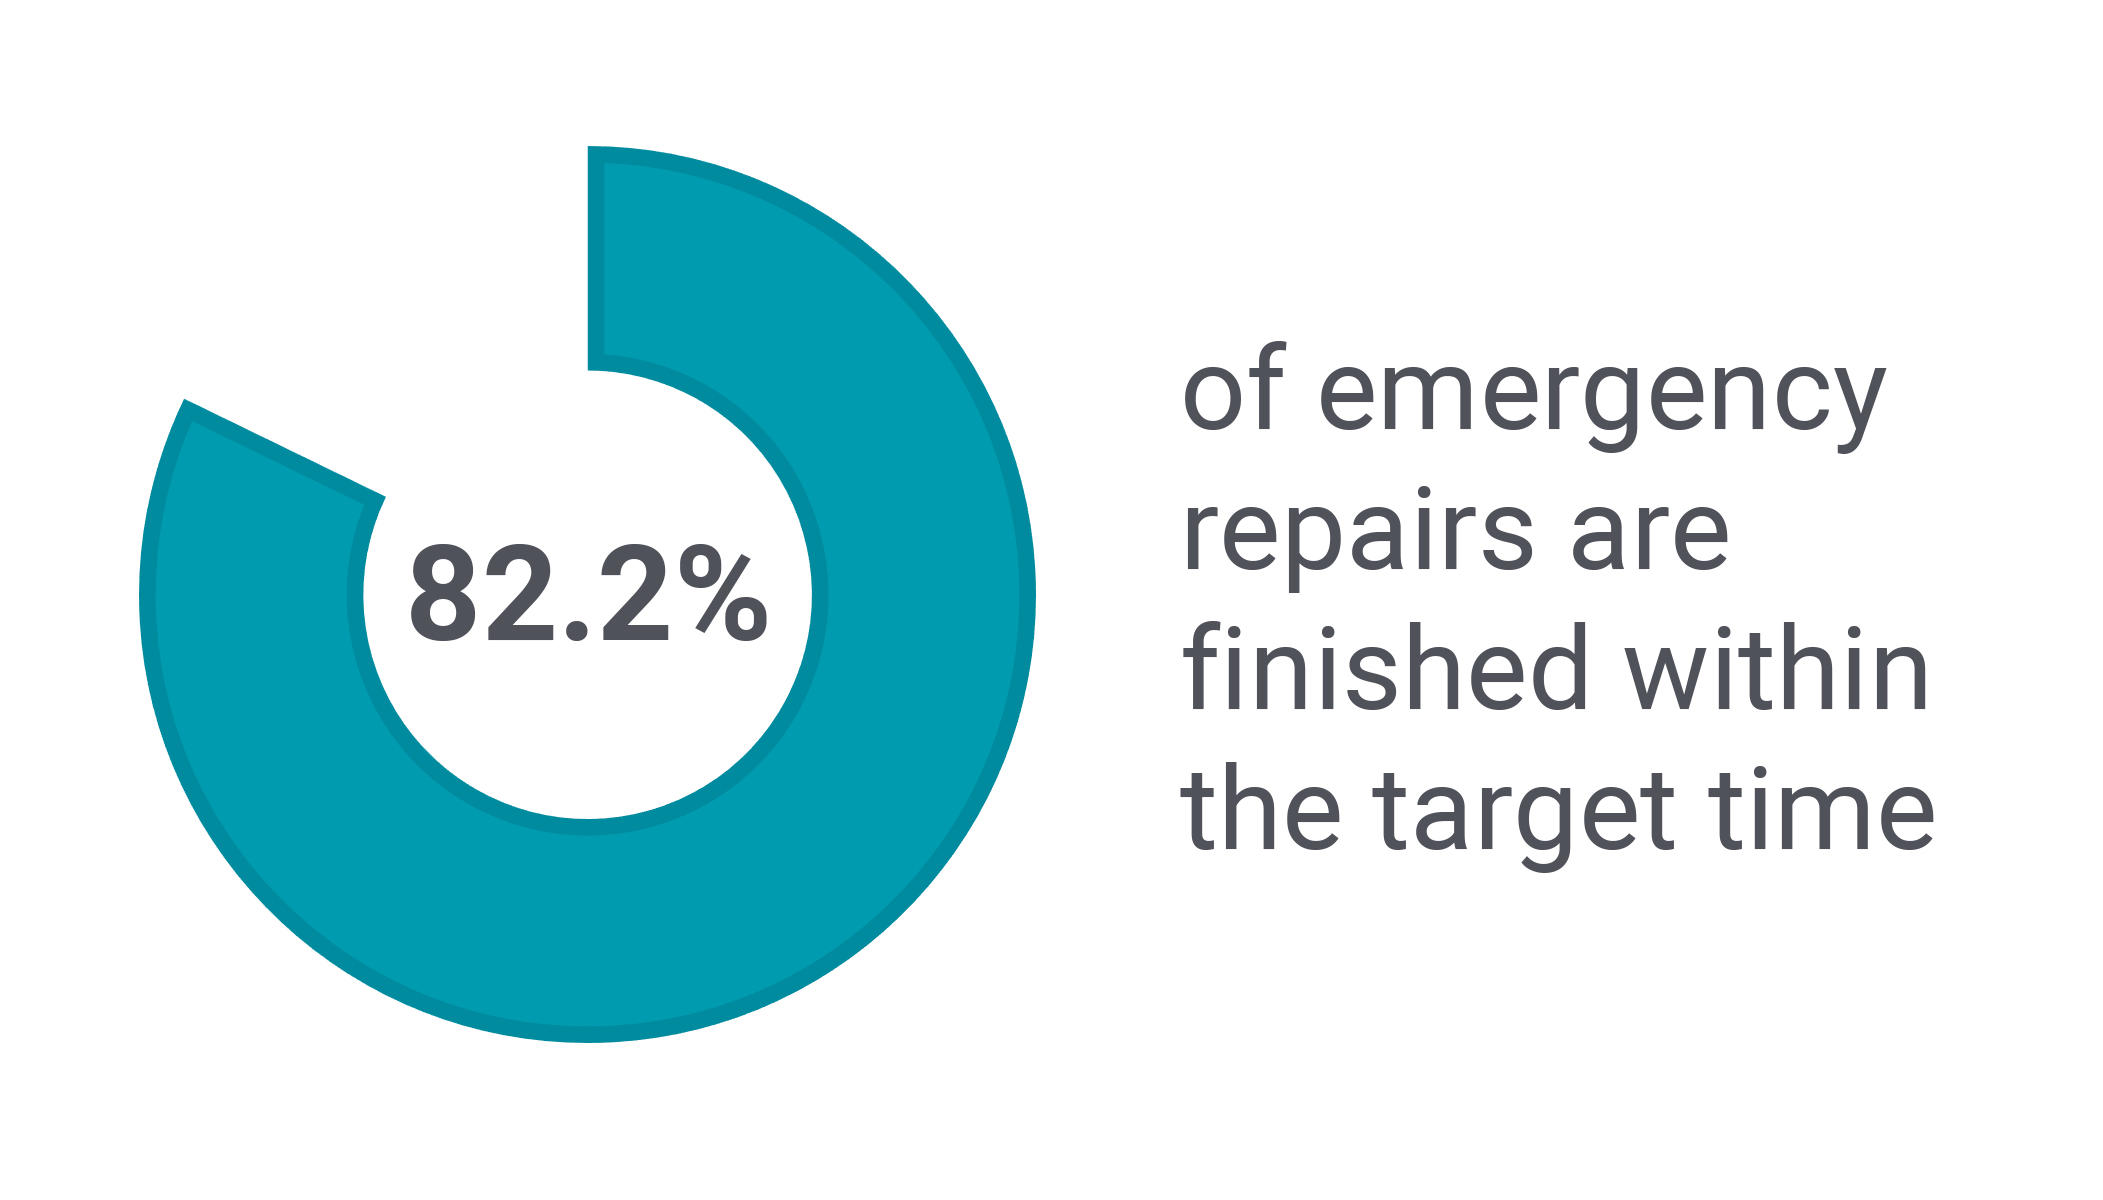
Ref: RP02(2)
Image grid
Advantages: Users don't need to click between accordion items
We can put target information and year on year comparison on the right hand side
Disadvantages: Each image is quite small


